Digital Commons Visualizations
Visual resources for understanding and implementing the Digital Commons Framework
These visualizations help communicate complex digital governance systems and commons-based approaches by providing accessible visual entry points to the framework. From architecture diagrams to flowcharts and analytical visualizations, these resources support stakeholders in implementing decentralized digital governance and fostering equitable access to digital resources.
Key Framework Visualizations
Core visualizations that illustrate the fundamental architecture and implementation approaches of the Digital Commons Framework.

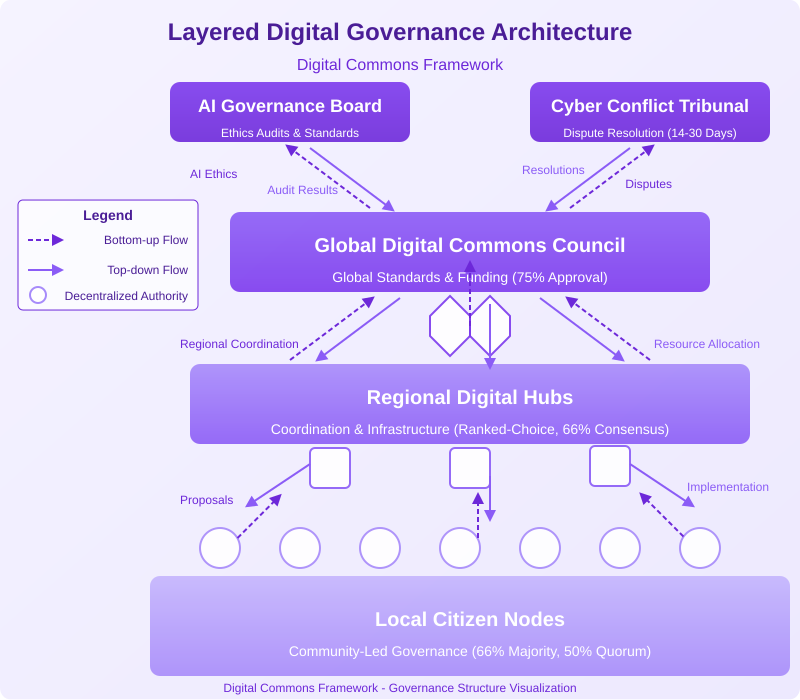
Layered Digital Governance Architecture
Illustrates the multi-level architecture of digital governance from Local Citizen Nodes to the Global Digital Commons Council, showing decision flows and accountability pathways.

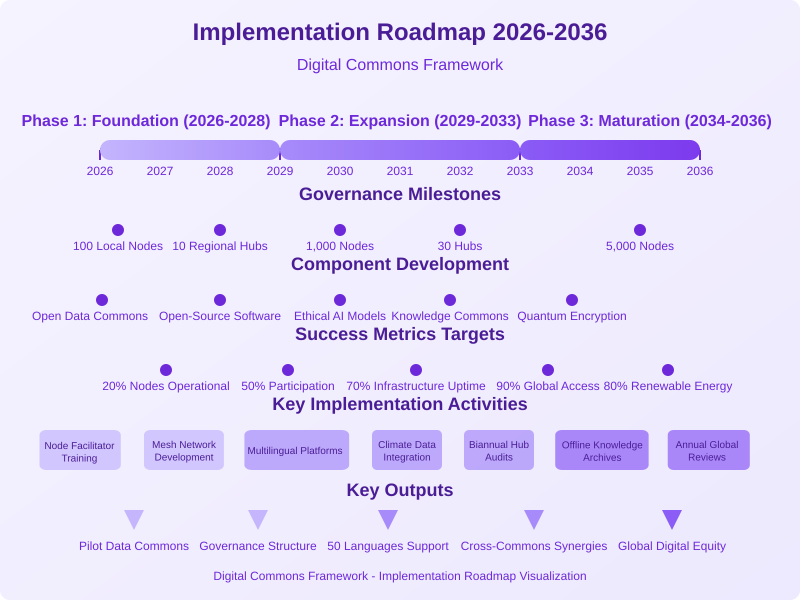
Implementation Roadmap 2025-2035
Outlines the phased approach for digital commons implementation over a 10-year horizon, detailing Foundation, Expansion, and Maturation phases with key milestones.

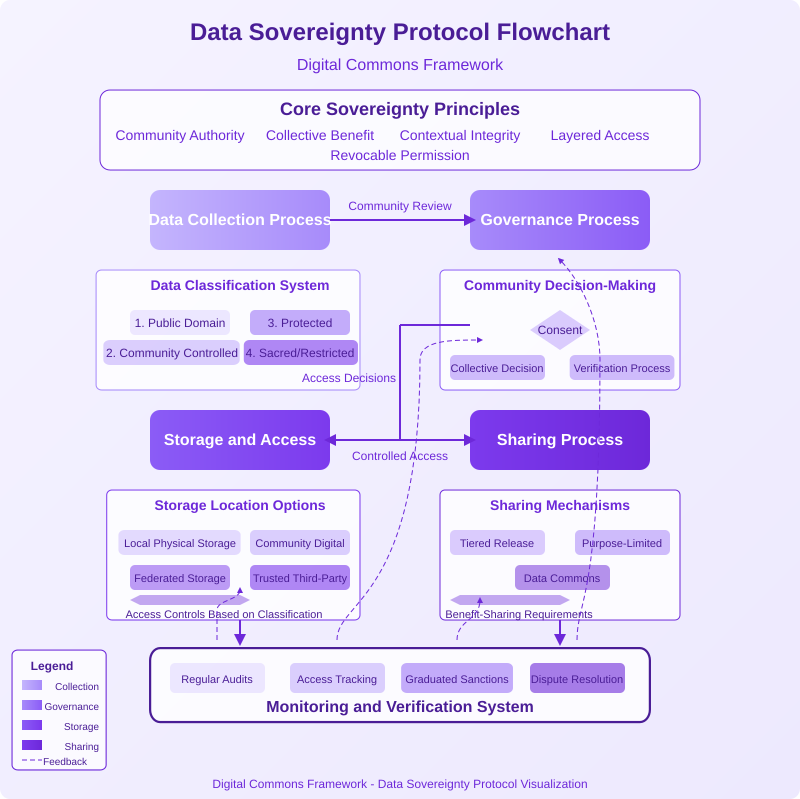
Data Sovereignty Protocol Flowchart
Diagrams the structure and flow of data governance processes, showing how communities maintain control while enabling beneficial data sharing.

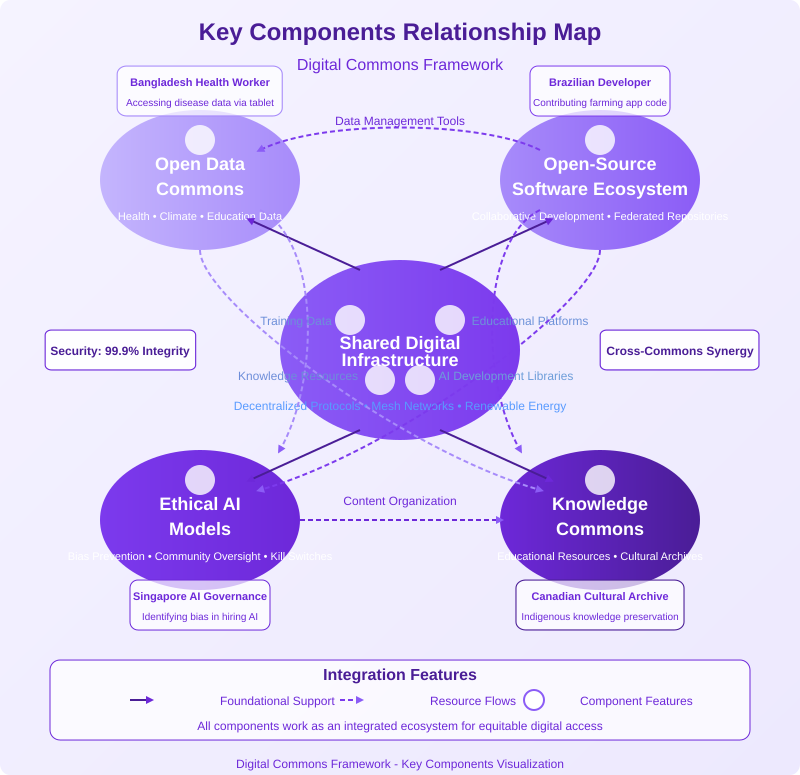
Key Components Relationship Map
Illustrates the critical interconnections between the five key components: Open Data Commons, Open-Source Software Ecosystem, Shared Digital Infrastructure, Ethical AI Models, and Knowledge Commons.

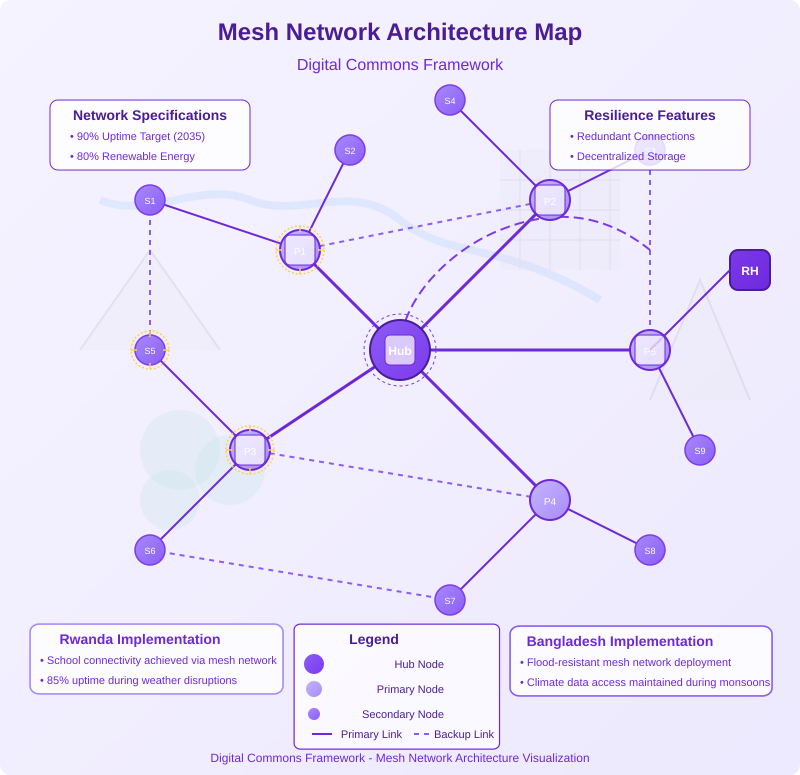
Mesh Network Architecture Map
Maps the decentralized infrastructure supporting the digital commons, visualizing node relationships, resilience mechanisms, and resource allocation systems.

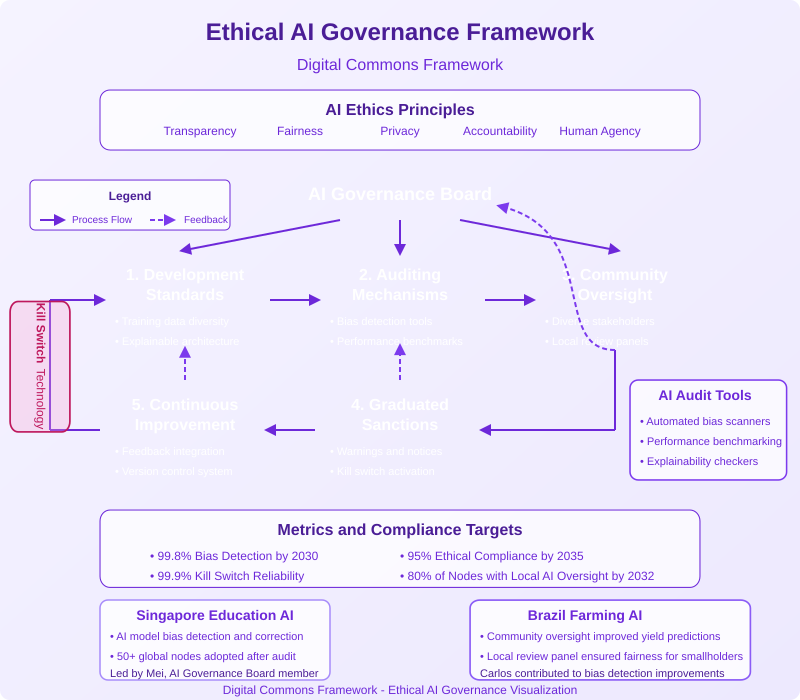
Ethical AI Governance Framework
Charts the governance processes for ensuring ethical AI deployment, from development through auditing to community oversight and continuous improvement.
Analytical Visualizations
These visualizations provide deeper analytical perspectives on digital commons, governance structures, and cross-system relationships.

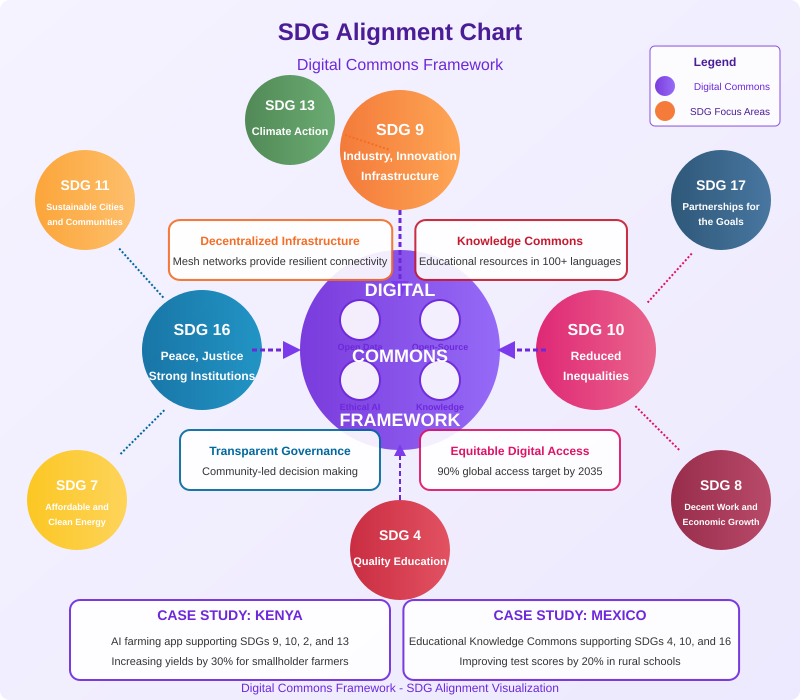
SDG Alignment Chart
Maps how the Digital Commons Framework aligns with and contributes to multiple Sustainable Development Goals, with SDG 9 (Industry, Innovation and Infrastructure) and SDG 10 (Reduced Inequalities) as central focus areas.

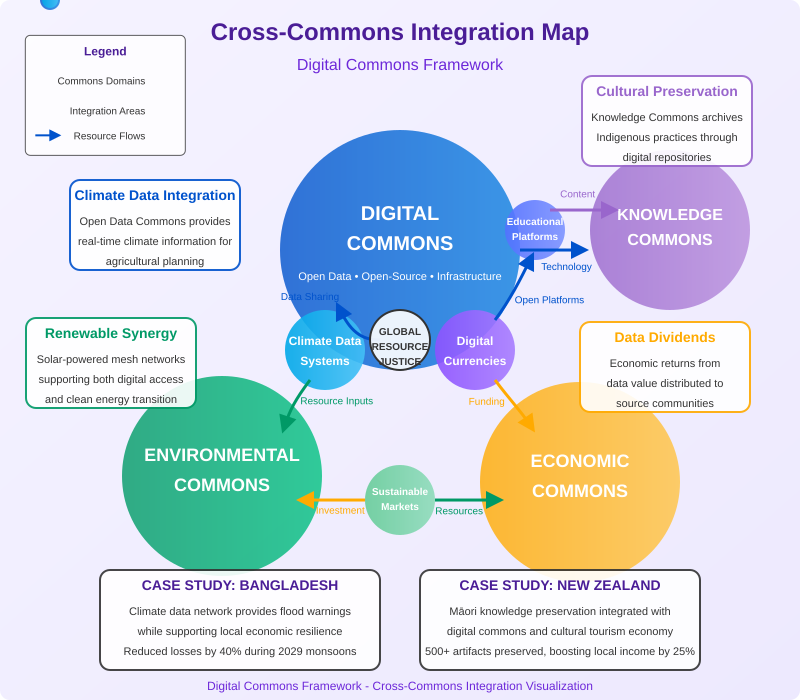
Cross-Commons Integration Map
Illustrates how digital commons interact with other commons domains (environmental, economic, knowledge), showing feedback loops and synergistic relationships.
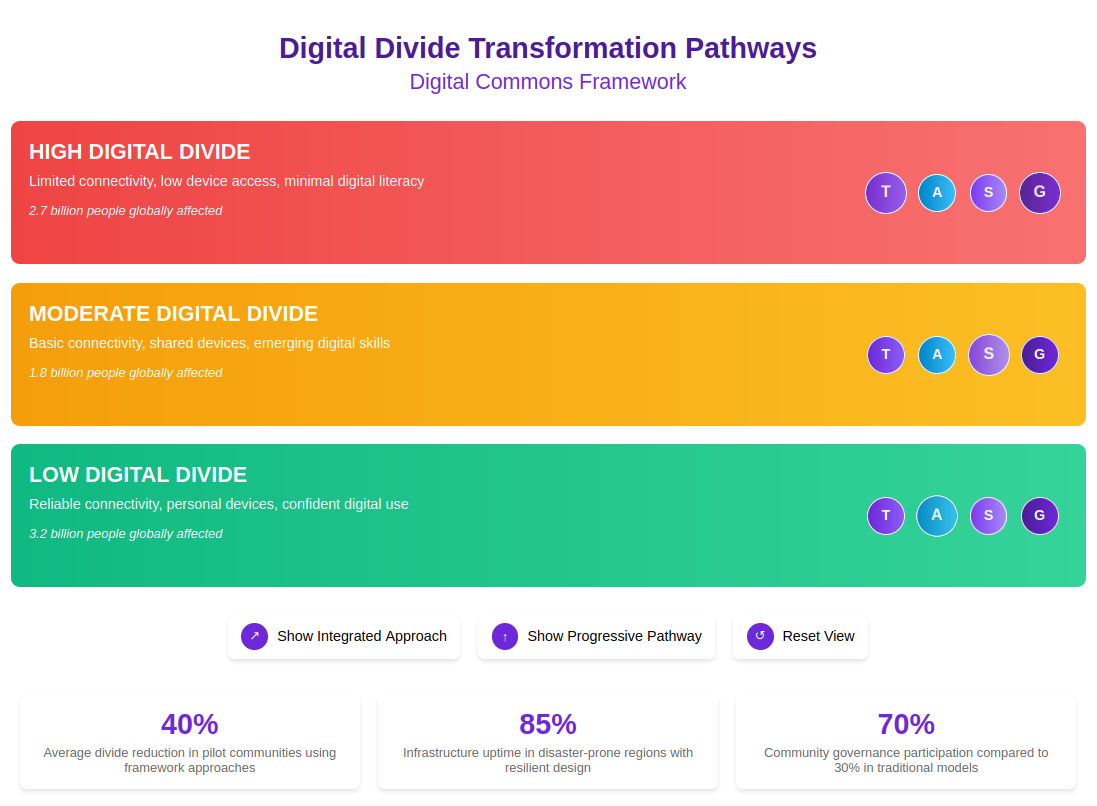
Digital Divide Transformation Pathways
Interactive visualization exploring how different accessibility approaches address barriers to digital participation across global contexts.
Technical Interactive Visualizations
Advanced interactive visualizations for technical applications and detailed analysis of digital governance systems and resource flows.
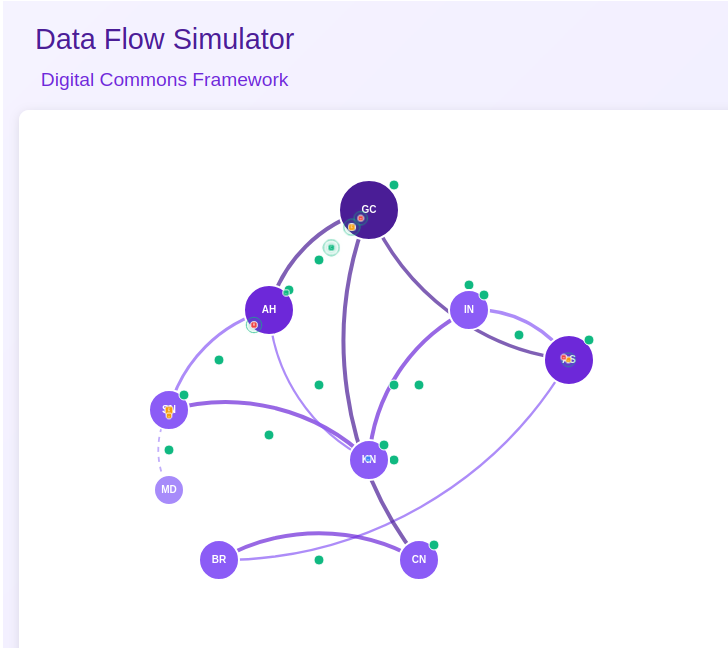
Data Flow Simulator
Interactive system allowing exploration of data sovereignty protocols in action, demonstrating how information flows while preserving community control.
Governance Simulation Tool
Interactive dashboard simulating governance processes across nodes, hubs, and councils, demonstrating voting, dispute resolution, and policy implementation.
Impact Assessment Visualization
Simulation of Digital Commons implementation effects across different contexts, demonstrating potential outcomes on metrics like accessibility, participation, and sovereignty.
Request Visualizations or Provide Feedback
Need specialized visualizations for a specific context? Have suggestions for improvements? We welcome your input to make these resources more useful. Contact us