Environmental Stewardship Visualizations
Visual resources for understanding and implementing regenerative environmental governance
These visualizations help communicate the Environmental Stewardship Framework's integrated approach to ecosystem rights, climate action, and regenerative governance. From conceptual diagrams to implementation roadmaps and monitoring dashboards, these resources support stakeholders in transforming environmental governance for planetary well-being.
Framework Architecture Visualizations
Core visualizations that illustrate the fundamental architecture and governance structure of the Environmental Stewardship Framework for Multi-Level Governance.

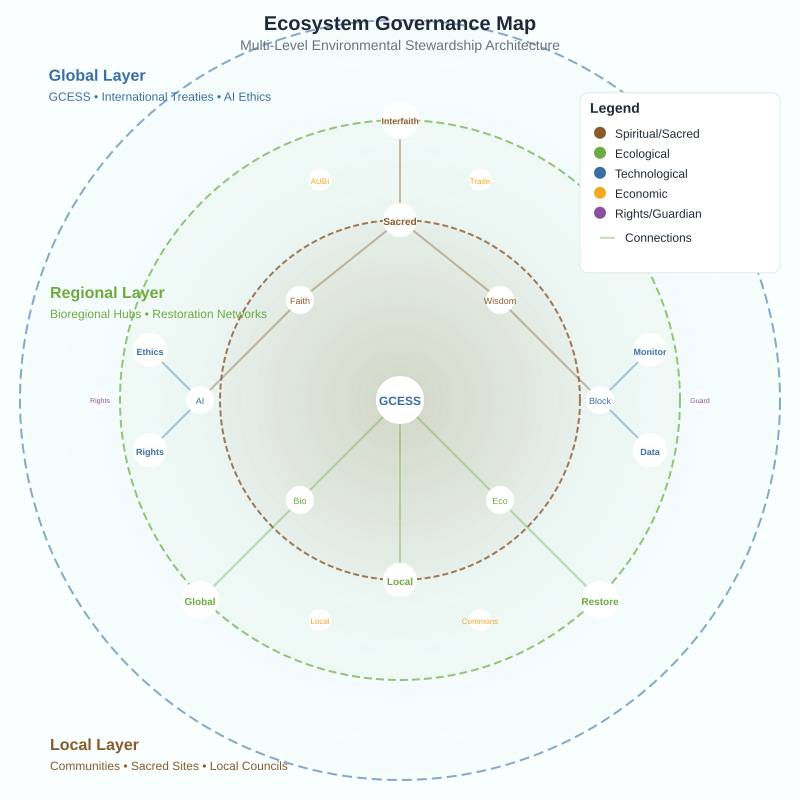
Ecosystem Governance Map
Radial layered visualization showing local-to-global governance with spiritual, ecological, and technological nodes, illustrating how communities, regional hubs, and global councils work together for environmental stewardship.

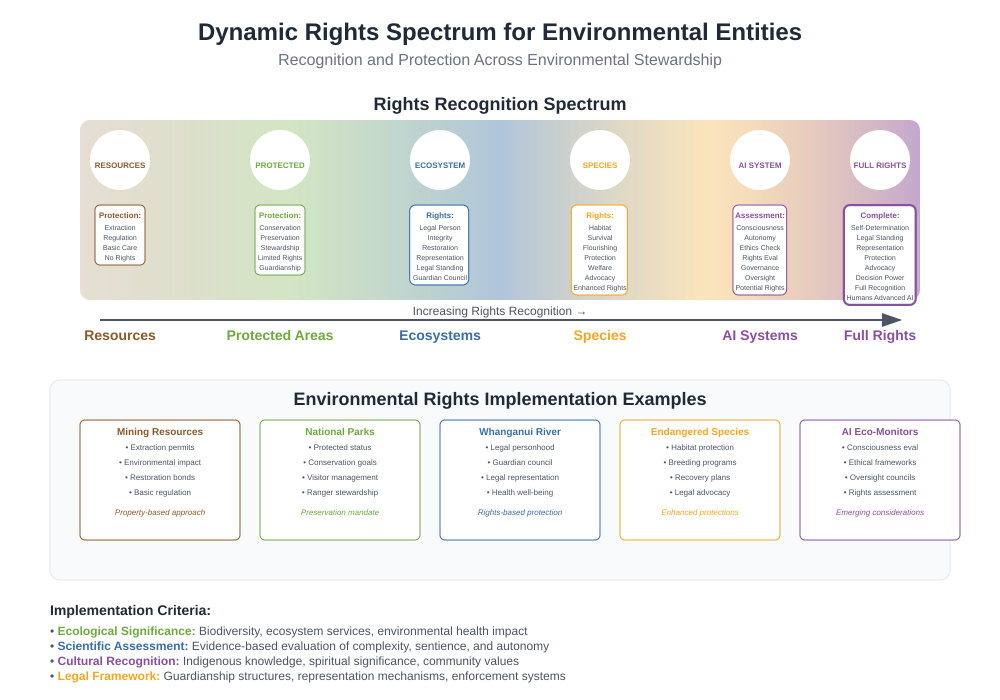
Dynamic Rights Spectrum for Environmental Entities
Visualization of rights progression from natural resources to ecosystems, species, and AI systems, showing how environmental stewardship recognizes and protects the rights of all beings in nature.

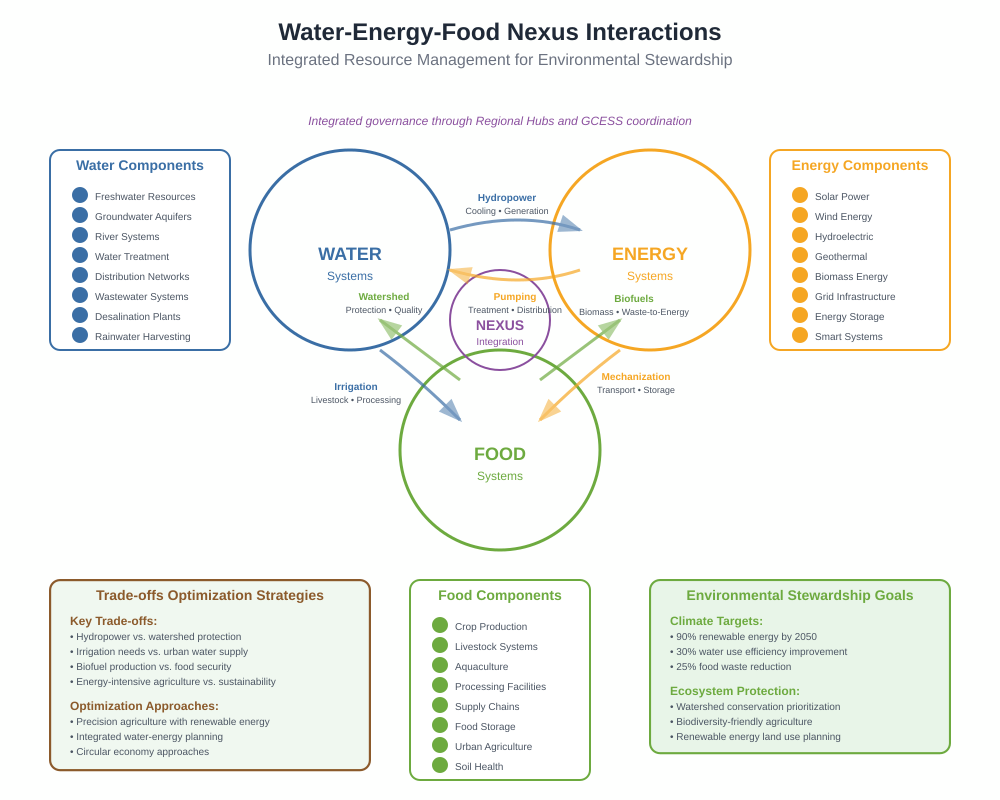
Water-Energy-Food Nexus Interactions
Diagram illustrating complex interactions between water, energy, and food systems, highlighting trade-offs and optimization opportunities for sustainable resource management.

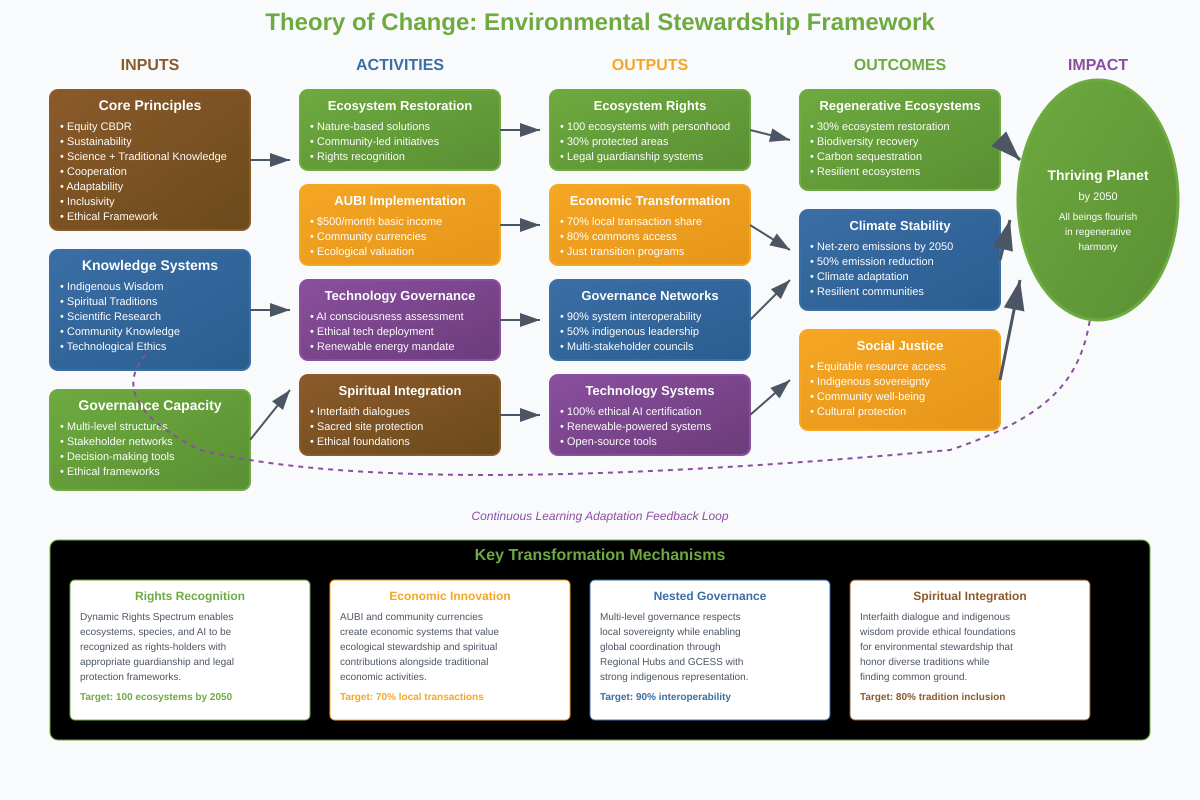
Theory of Change Diagram
Visual representation of how principles like equity and adaptability drive actions such as AUBI and ecosystem personhood to achieve regenerative outcomes and thriving ecosystems.
Implementation & Roadmap Visualizations
Visual guides for framework implementation, including timelines, stakeholder engagement processes, and phased deployment strategies.
Implementation Roadmap (2026-2050)
Comprehensive visual timeline showing phased implementation from capacity building through full deployment, with milestones, risk scenarios, and adaptive pathways.
Stakeholder Engagement Network
Interactive map showing relationships between municipalities, indigenous groups, spiritual leaders, NGOs, private sector, and youth in environmental governance implementation.
Global Pilot Implementation Map
World map showcasing pilot regions (Amazon, Sahel, Pacific Islands) with real-time progress indicators, success metrics, and implementation strategies.
Interactive Monitoring Tools
Advanced interactive visualizations for ecosystem health monitoring, progress tracking, and adaptive management across environmental stewardship initiatives.
Ecosystem Health Dashboard
Real-time monitoring dashboard displaying ecosystem health indicators, biodiversity metrics, climate adaptation progress, and restoration achievements across pilot regions.
Rights Recognition Atlas
Interactive atlas tracking legal personhood status for ecosystems, species protection enhancements, and AI consciousness assessments across different jurisdictions and pilot areas.
Community Well-Being Index Tracker
Dynamic visualization tracking community well-being improvements linked to ecosystem restoration, showing mental health benefits, economic indicators, and social cohesion metrics.
Request Visualizations or Provide Feedback
Need specialized visualizations for a specific environmental context? Have suggestions for improvements? We welcome your input to make these resources more useful. Contact us